I have been wanting to talk about this and other similar topics for a long time. Finally, today is de day, mainly because «someone reminded me that I’ve to do it !» So, let’s start:
1. Add following NuGet dependencies:
- Serilog.AspNetCore
- Serilog.Sinks.Elasticsearch
- [Optional] Serilog.Enrichers.Environment
Obviously if you are working with Serilog don’t forget to also add «Serilog.Sink.Console», you will see a rich console of log information with color, a better formatting, and much more.
2. Include below sentence and update it according to your Elasticsearch environment.
builder.Host.UseSerilog((context, services, config) =>
{
config
.MinimumLevel.Information()
.Enrich.WithMachineName()
.WriteTo.Console()
.WriteTo.Elasticsearch(
    new ElasticsearchSinkOptions(new Uri(context.Configuration["ElasticSearch:Uri"] ??
                                            "http://localhost:9200"))
    {
        IndexFormat =
        ${context.Configuration["ApplicationName"]?.ToLower().Replace(".", "-")}-logs-{DateTime.UtcNow:yyyyMM}",
        AutoRegisterTemplate = true,
        DetectElasticsearchVersion = true
    }).Enrich.WithProperty("Environment", context.HostingEnvironment.EnvironmentName)
.ReadFrom.Configuration(context.Configuration);
});
You can set values for properties «NumberOfShards», «NumberOfReplicas» between others, like ModifyConnectionSettings:
ModifyConnectionSettings = x =>
    x.BasicAuthentication(context.Configuration["ElasticSearch:User"],
        context.Configuration["ElasticSearch:Password"]),
And others related to failures when trying to send events to ElasticSearch. It will be useful to understand what will happen if the ElasticSearch index cannot be created or something goes wrong trying to send those events, like this:
FailureCallback = (ex) =>
    Console.WriteLine("Unable to submit event " + ex.MessageTemplate),
EmitEventFailure = EmitEventFailureHandling.WriteToSelfLog |
                    EmitEventFailureHandling.WriteToFailureSink |
                    EmitEventFailureHandling.RaiseCallback,
FailureSink = new FileSink($"./fail-{DateTime.UtcNow:yyyyMM}.txt",
    new JsonFormatter(), null, null)
3. Replace or update your appSettings.json whith this one (as an example):
{
  "Serilog": {
    "MinimumlLevel": {
      "Default": "Information",
      "Override": {
        "Microsoft": "Information",
        "System": "Warning"
      }
    }
  },
    "ElasticSearch": {
        "Uri": "http://localhost:9200",
        "User": "YOUR-USER",
        "Password": "YOUR-PASSWORD"
    }
}
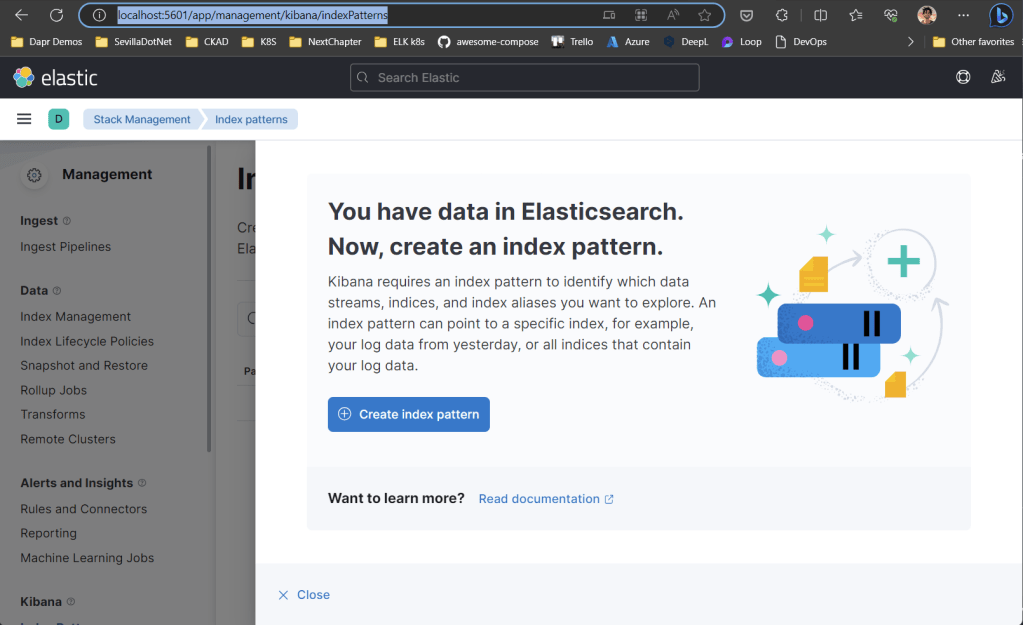
4. Run the Asp.Net API and navigate to «http://localhost:5601/app/management/kibana/indexPatterns» and click on «Create index pattern».

5. Create an index pattern with a name regarding to the IndexFormat property previously configured: «cocktaildev-products-api-logs-development-*» and select @timestamp value for the»Timestamp field»:

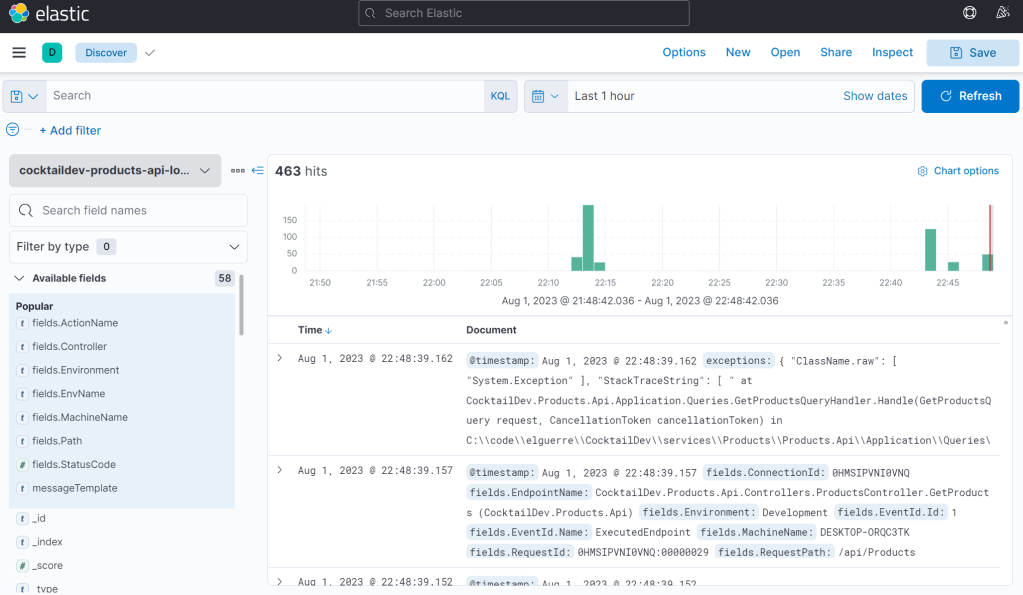
6. Navigate to option menu: Home/Analytics/Discover and voila:

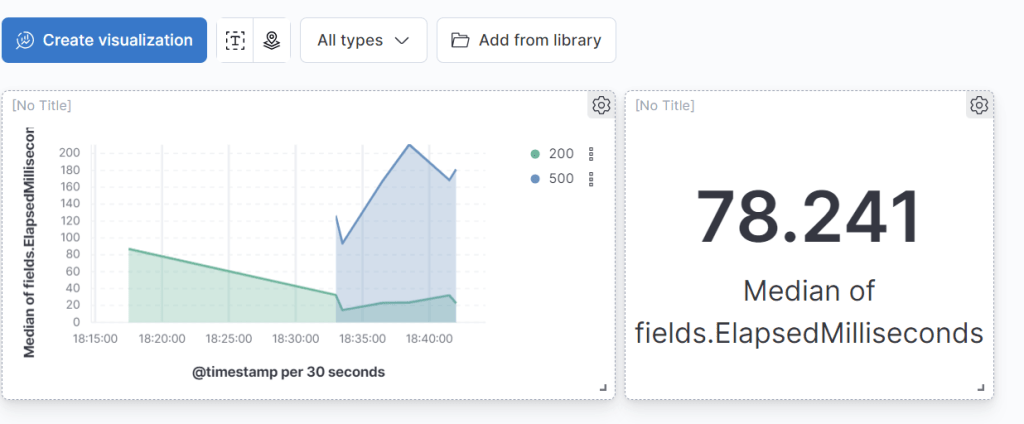
7. Optionally you can now play with Dashboards to get the Wow effect of your logs.

Here is the docker-compose.yaml that I have used (to set up my Elasticsearch/Kibana environment) where I am using ElasticSearch:7.16.1 and ports 9200 and 5601 as default ports for Elasticsearch and Kibana respectively.
version: '3'
 services:
  elastic:
    container_name: elastic
    hostname: elastic
    image: docker.elastic.co/elasticsearch/elasticsearch:7.16.1
    environment:
      - discovery.type=single-node
    volumes:
      - YOUR-ROOT/elasticsearch/data:/usr/share/elasticsearch/data
    ports:
      - 9200:9200
      - 9300:9300
    mem_limit: 1024m
    mem_reservation: 512m
    networks:
      - infra_net
  kibana:
    image: docker.elastic.co/kibana/kibana:7.16.1
    environment:
      SERVER_NAME: kibana
      ELASTICSEARCH_URL: http://elastic:9200
      ELASTICSEARCH_HOSTS: http://elastic:9200
      discovery.type: single-node
    ports:
      - 5601:5601
    volumes:
      - YOUR-ROOT/kibana/data:/usr/share/kibana/data
    depends_on:
      - elastic
    mem_limit: 2048m
    mem_reservation: 512m
    networks:
      - infra_net
networks:
  infra_net:
    driver: bridge
Hope this help. Happy logging !!
References