

TL;DR
Continuing our series on Tendero, the AI-native ecommerce platform, in this article I make the shop observable, from the .NET services to the browser, and name the event that proves each feature is used.
- I asked every feature one question: which signal proves it is used, and worth it? Three of eighteen could answer, and none of them sold anything.
- On a laptop, the Aspire dashboard stays, and one switch adds Grafana, which keeps history. Outside the laptop, Grafana is the one that matters. The browser sends telemetry too, so one click is one trace from the page to the search engine.
- The first dashboard lied twice: once about conversion, once about what it sent. Both are fixed, and the second one mattered more.
Tendero had traces in nearly every .NET slice, custom metrics in two files, and nothing at all from the browser. Everything went to the Aspire dashboard, which keeps its data in memory and forgets it when you stop the app.
So before building more features, I asked each existing one a single question:
Which event proves it is used, and that it is worth it?
Eighteen features. Three could answer with a signal the code already sent: the AI search layer, the outbox, and the WebMCP tools. All three are plumbing. Search, the cart, checkout, returns, publishing a product — none of them could say, in numbers, that anybody used them.
This article closes that gap: where the telemetry goes, what each tool adds, how the browser joins in, and the rule that now stops a feature from shipping silent.
A few words first, because the rest of the article uses them:
- Telemetry is what a running program reports about itself. It comes in three kinds: traces, metrics and logs.
- A trace is the story of one request. It is made of spans: one span for each step, such as «the API answered» or «Elasticsearch searched», each with its start and its duration.
- A metric is a number over time: orders per minute, searches with no result.
- A log is a line of text with a time and some fields.
- OpenTelemetry (OTel) is the open standard for all three. OTLP is its protocol: the format and the way telemetry travels from a program to whoever stores it.
Two ways to watch the shop
Tendero runs locally with .NET Aspire. Aspire starts every part of the shop with one command, and it comes with a dashboard that shows the telemetry of all of them. That dashboard is very good at one thing: showing a developer what just happened. It has no history, no dashboards of your own, and no way to ask «how did this look an hour ago?».
I did not replace it. I added a second mode behind a switch:
Tendero__Observability=true dotnet run --project src/AppHost
→ Reference: src/AppHost/AppHost.cs, lines 307–308, where the switch is read
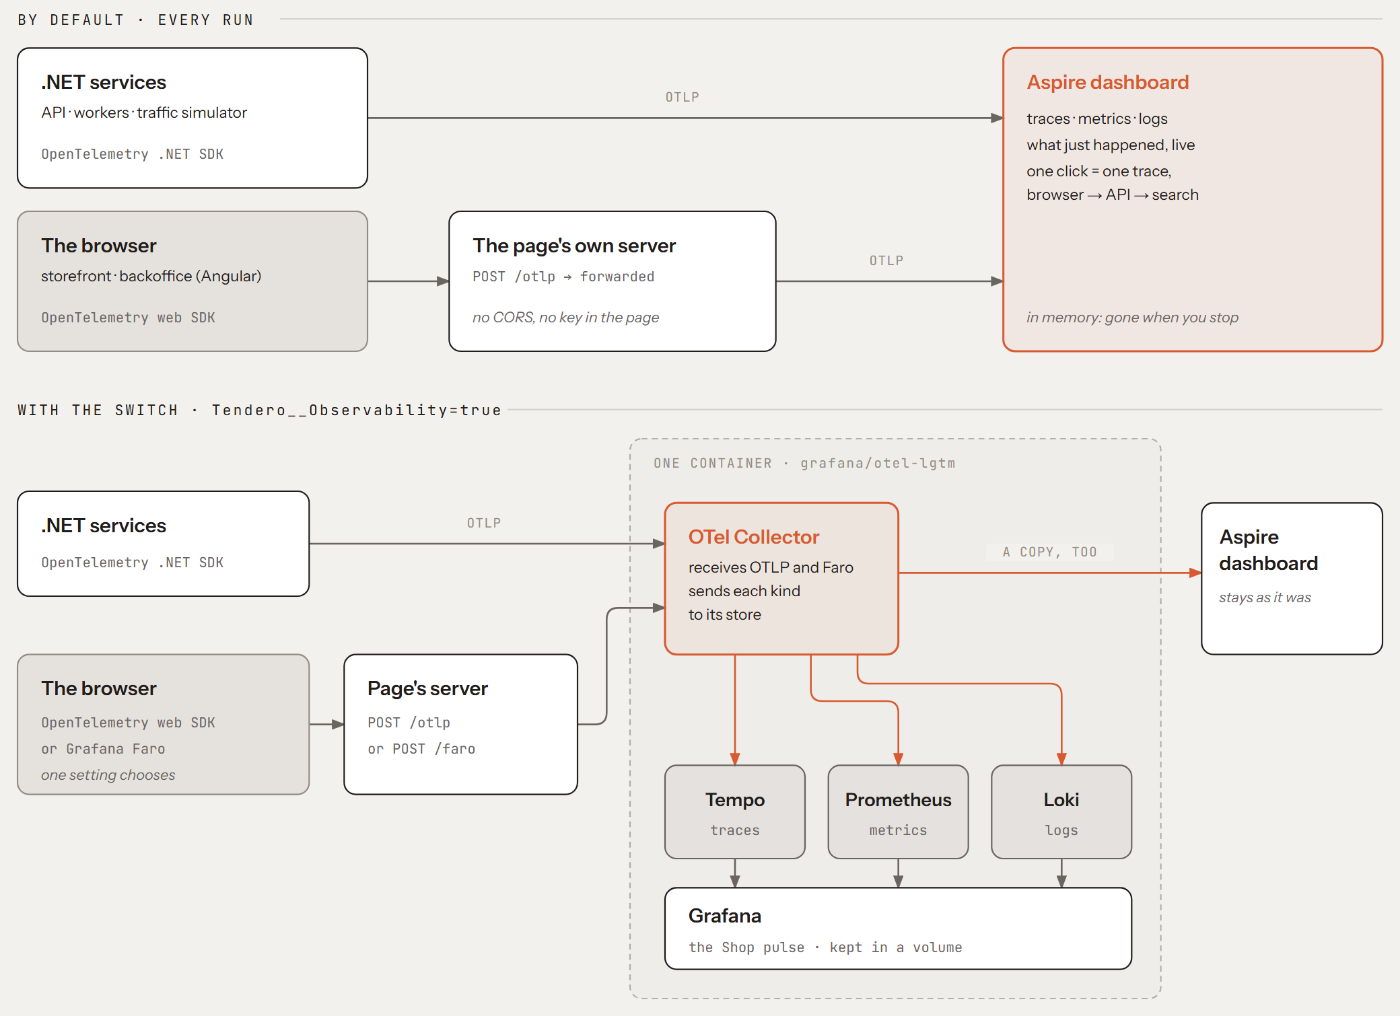
With the switch on, Aspire also starts one container, grafana/otel-lgtm. It is a single Docker image that Grafana publishes for development and demos, and inside it there are five programs, each one in its own process. LGTM stands for four of them: Loki, Grafana, Tempo and Mimir. This image uses Prometheus for metrics instead of Mimir, but the name stayed.
| Program | What it does | Think of it as |
|---|---|---|
| OpenTelemetry Collector | Receives everything over OTLP and sends each kind where it belongs | A router for telemetry |
| Tempo | Stores traces | A store of spans |
| Prometheus | Stores metrics | A database of numbers over time |
| Loki | Stores logs | A store of log lines |
| Grafana | Draws and queries the three stores | The screen |
This is the path:
services ──OTLP──► Collector ──► Tempo (traces) ├──► Prometheus (metrics) ├──► Loki (logs) └──► Aspire (the copy we added)Grafana ──queries──► Tempo, Prometheus, Loki
The image comes with the Collector, the three stores and Grafana already connected to each other. We added three things: the copy the Collector sends on to the Aspire dashboard, the receiver for Faro (more on it below), and the Shop pulse dashboard, loaded when the container starts. Every service sends its telemetry to the Collector instead of to the dashboard, so you gain a view with history, and you lose nothing: the dashboard you had open still works.
It did not work the first time. The Aspire dashboard started refusing hundreds of requests a minute with invalid wire type, and none of them came from Tendero. Aspire’s WithOtlpExporter() on the container gave the standard OTEL_ variables to every program inside it — Grafana, Tempo, Loki, Prometheus — and each one started sending its own telemetry straight at the dashboard. I found it by stopping the Collector and watching the error count freeze. The fix copies the dashboard’s address under two names that only the Collector reads, and removes every OTEL_ variable from the container.
→ Reference: src/AppHost/AppHost.cs, lines 832–850
What each piece gives us, and why it is here
Observability brings many names at once. The container’s five programs are above; these are the rest — what sends the telemetry and the dashboard that shows it by default — with what each one adds and what we would miss without it.
| Piece | What it is | What it gives us | Without it |
|---|---|---|---|
| OpenTelemetry .NET SDK | The libraries every .NET service loads, through Aspire’s service defaults | A span for every request, every HTTP call and every slice that does I/O; runtime metrics; the shop’s own counters | The dashboard would show console output and little else |
| Aspire dashboard | Comes with Aspire; receives OTLP | Traces, metrics and logs of every service, live, with no setup | Each service would be a separate console window |
| OpenTelemetry web SDK | The same standard, in the browser | Spans for the page’s requests, its errors and its events, joined to the API’s spans | Every trace would start at the API, and the browser would be invisible |
| web-vitals | Google’s small library for Core Web Vitals | How fast the page appears and answers, measured on real visits | We would guess how fast the shop feels |
| Grafana Faro | Grafana’s own SDK for the browser | A second browser adapter, used to compare against OpenTelemetry | Nothing is lost: OpenTelemetry is the default |
The versions at this tag: OpenTelemetry .NET 1.18.0, the OpenTelemetry web SDK 2.11.0, web-vitals 6.2.2, Faro 2.12.1, and grafana/otel-lgtm 0.33.1. The libraries are Apache-2.0, so they can ship inside Tendero. Inside the container, Prometheus and the Collector are Apache-2.0 too, and Grafana, Tempo and Loki are AGPLv3. That is fine for a container we run beside the app and never change; it would not be fine for a library we linked.
→ Reference: src/ServiceDefaults/HostingExtensions.cs, lines 51–69, where every .NET service turns OpenTelemetry on and sends OTLP to whatever address Aspire gives it
That last point is the whole trick of the switch. A service does not know where its telemetry goes. Aspire tells it, in one variable, OTEL_EXPORTER_OTLP_ENDPOINT, when it starts the service: the dashboard by default, the Collector with the switch on. No service changes.
On your machine, and everywhere else
Everything above runs on one machine. That is where Aspire is at home: the AppHost starts the whole shop with one command, and its dashboard shows one developer what just happened. Locally, that is almost always enough, and Grafana is optional.
Outside the laptop — a test server, a staging environment, production — the questions change. Many people look at the same shop. They ask about yesterday and last week, not the last minute. Somebody wants an alert when checkouts fail, not a page they must remember to open. The Aspire dashboard can run on its own, but it still keeps everything in memory, for whoever has it open. This is where Grafana takes the weight:
| On your machine | Anywhere else | |
|---|---|---|
| Who looks | You, while you code | The team, every day |
| What you ask | «What did that click just do?» | «How did checkout do this week?» |
| Where telemetry goes | The Aspire dashboard; Grafana if you turn it on | A Collector, then stores that keep it, then Grafana |
| History | Gone when you stop the app | Kept for as long as you decide |
| Alerts | None | Grafana’s, over the same series |
The code does not change between the two. A service only reads OTEL_EXPORTER_OTLP_ENDPOINT, so in another environment it is pointed at that environment’s Collector. The Shop pulse dashboard is a file in the repository, so it travels too. What changes is what runs beside the shop: grafana/otel-lgtm puts everything in one container, which is right for a laptop and a demo, and wrong for production: it cannot grow, and if the container stops, all five programs stop with it. There, the Collector, Tempo, Prometheus (or a store built for more data), Loki and Grafana run as separate services, or a hosted Grafana takes their place.
Tendero is not deployed anywhere yet; it is a laboratory. So the right column is the direction, not something I have measured. But the left column was built so that the right one needs no new code.
The browser joins the trace
In .NET, OpenTelemetry is already the abstraction, so no port is needed. In the browser it is different. OpenTelemetry’s web SDK is still experimental, and Grafana Faro, the main alternative, has its own API. So the frontend gets a port, libs/shared/telemetry, with only what our code sends — events, errors, spans, the current route — and each SDK becomes an adapter behind it.
Three rules shape it:
- The page never waits for telemetry. The adapter is loaded after the first render, as a separate file. The OpenTelemetry one is 26 KB gzip, and the first download of the page grew by only 0.8 KB.
- Telemetry never breaks the shop. If an adapter fails to load, fails to start or fails later, a do-nothing adapter takes its place, and a test proves the page carries on.
- The browser sends to its own server. The page posts to
/otlpon the server that serves the page, and that server forwards it. (The Faro adapter posts to/farothe same way.) Aspire gives the page’s server the same address and key it gives every service. So there is no CORS problem, nothing an ad blocker can match, and no dashboard key inside the page.
→ Reference: frontend/libs/shared/telemetry/src/lib/provide-telemetry.ts, lines 35–38, where each adapter is loaded only when needed, and frontend/apps/backoffice/proxy.conf.mjs, lines 28–55, where the page’s server forwards /otlp
With that in place, one click is one trace. The browser’s request carries a traceparent header, a standard header with the trace’s id, so the API’s spans join the browser’s:
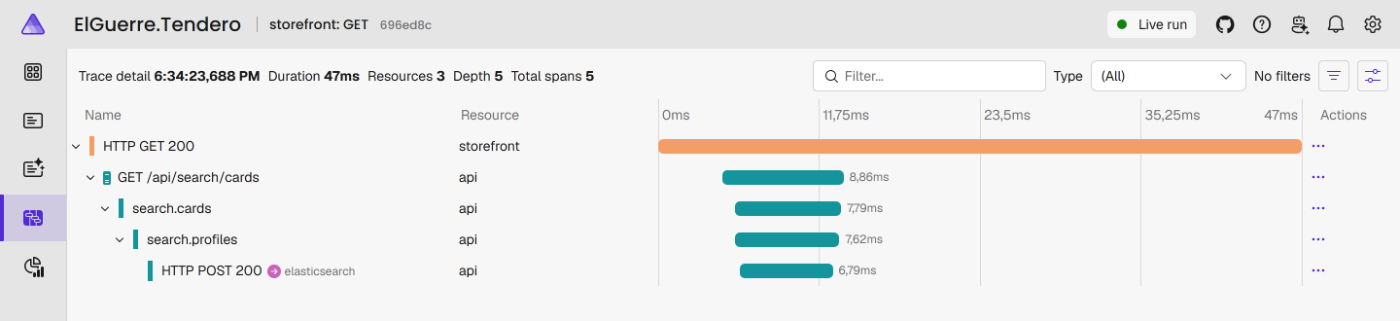
Look at the two numbers at the top. The API worked for 9 ms. The shopper waited 47 ms. The other 38 ms are the network and the browser itself. Without telemetry from the browser, we would only see the 9 ms, and believe the shop is faster than it feels.
The question, as a rule
The question at the top of this article is now part of Tendero’s definition of done. A feature names the signal that proves it is used, and the decision its value would change. A signal with no decision does not enter the plan.
The plan is one JSON file, docs/telemetry/tracking-plan.json: the list of everything the shop measures, and why. It has three lists:
features: for each feature, the question we want the data to answer, the decision the answer would change, and the signals that give the answer.metrics: every number the .NET services send, with its type, its unit and the attributes it may carry.events: the same for what the browser sends, plus the consent each event needs.
So a signal named in a feature is also defined in the same file, and nothing is measured «just in case». This is one entry of features, the one for returns:
{ "name": "Returns", "area": "storefront", "question": "Why do things come back?", "decision": "Wrong size and not-as-described are the product reasoning layer's case (phase 10); damaged and wrong item are the warehouse's.", "signals": [ "tendero.returns.requested" ]}
→ Reference: docs/telemetry/tracking-plan.json, lines 68–77
Read it like this: the question is why things come back, and the counter tendero.returns.requested answers it, because it counts every line of a return with its reason, one of five: wrong size, not as described, damaged, wrong item, or changed mind. The decision says what we do with the answer. If things come back because the size was wrong or the description was not true, the fix is better product information. If they come back damaged, or the wrong item was sent, the fix is in the warehouse.
The JSON is the only place where the plan is written. A small Node script, tools/tracking-plan.mjs, reads it and writes two other files from it:
- A page for people,
docs/telemetry/tracking-plan.md. It is the same plan as a normal document: each feature with its question, its decision and its signals. Nobody has to read JSON to know what the shop measures. - A TypeScript type for the frontend,
tracked-events.ts. It lists every event the browser may send, with its attributes and the values each one allows. This is one entry:
readonly webmcp_tool_invoked: { readonly tool: string; readonly outcome: 'answered' | 'refused' | 'failed';};
→ Reference: frontend/libs/shared/telemetry/src/lib/generated/tracked-events.ts, lines 17–22
The frontend sends an event through one method, trackEvent, and that method only accepts a name from this type, with exactly the attributes the type gives it:
trackEvent<N extends TrackedEventName>( name: N, attributes: TrackedEvents[N],
→ Reference: frontend/libs/shared/telemetry/src/lib/telemetry.ts, lines 71–73
So if a developer writes trackEvent('button_clicked', …) and that event is not in the plan, TypeScript stops the build. The same happens with a missing attribute, or with a value the plan does not allow, such as outcome: 'ok'. In short, an event nobody planned does not compile. To add one, you add it to the JSON first, with its question and its decision, and run the script again.
On the .NET side, a test (TrackingPlanTests) finds every metric the code creates and compares it with the plan, in both directions: a metric that is not in the plan fails, and a planned metric that nothing sends fails too. It finds them by reflection, because a counter whose name is a constant is invisible to a text search. It also refuses any attribute named like an id: in Prometheus, an id is a new series for every customer.
Writing the plan was the useful part. It found two things I did not know:
- No cart is ever marked as abandoned. The code has an
Abandonedstate for a cart, and anExpiredstate for a stock reservation, but nothing ever moves a cart or a reservation into them: that part was never written. So, to measure abandoned carts, I count the carts that were opened and the orders that were placed, and compare the two numbers. - My own list had a feature the shop does not have. I had written Filters, the options beside a list of products that narrow it, such as brand or price, and asked whether people use them. The shop did not have them yet. I took that line out of the plan.
Then came the metrics themselves — ten of them, each recorded where its fact is born. Checkout is a good example. Its handler returns from eight different places: placed, declined, a price that changed, an unknown shipping option… A counter in each place is a counter that one day misses one. So the attempt is counted once, around the whole handler:
public static void Record(PlaceOrderResult result, Actor actor) => Attempts.Add(1, actor.KindLabel, actor.SurfaceLabel, new("outcome", MetricLabels.Of(result.Outcome)), new("discounted", result.Pricing?.Discounts.Count > 0 || result.Order?.Discounts.Count > 0));
→ Reference: src/Ordering/Features/Checkout/Checkout.cs, lines 424–431, one comment left out
actor.kind and surface say who acted and through which door: a person on the web, or an agent over MCP or UCP. The server decides them from the route, never from a header the client sends. MCP and UCP callers are anonymous by design, so the logged-in user alone would have counted every external agent as a person.
Two orders, a conversion of 0 %
This is where Grafana earns its place. The dashboard is called Shop pulse. It is a JSON file in the repository, loaded into Grafana when the container starts, and a test checks that every series it reads is one the plan produces. Nobody builds it by hand, and nobody loses it.
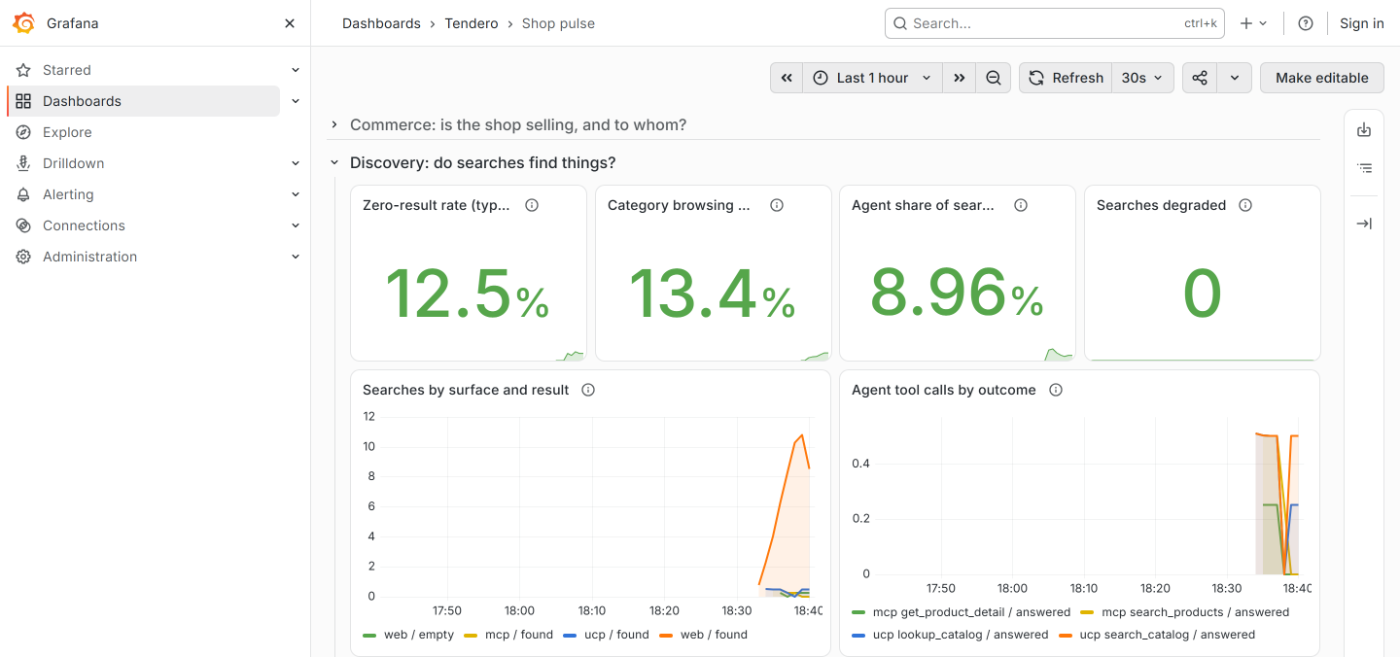
Every row of the dashboard starts with a question, the same one the tracking plan asks. The searches here come from people on the web and from agents over MCP and UCP, and Grafana can tell them apart because every count carries who searched and through which door.
The first time I looked at it with real traffic, it said two orders placed and a checkout conversion of 0 %.
Both orders had been placed within one export interval. So the counter’s first value in Prometheus was already 2. Prometheus’s increase() needs an earlier value to measure an increase, found none, and read zero. Every new counter in a quiet shop has this problem.
OpenTelemetry sends the time each counter started. Prometheus can write a zero at that moment, if you ask it to:
.WithEnvironment("PROMETHEUS_EXTRA_ARGS", "--enable-feature=created-timestamp-zero-ingestion")
→ Reference: src/AppHost/AppHost.cs, line 335, and the test that holds it: tests/Architecture.Tests/CollectorConfigurationTests.cs, line 90
After that, the same two orders out of four attempts read 50 %. A test now fails if that line disappears.
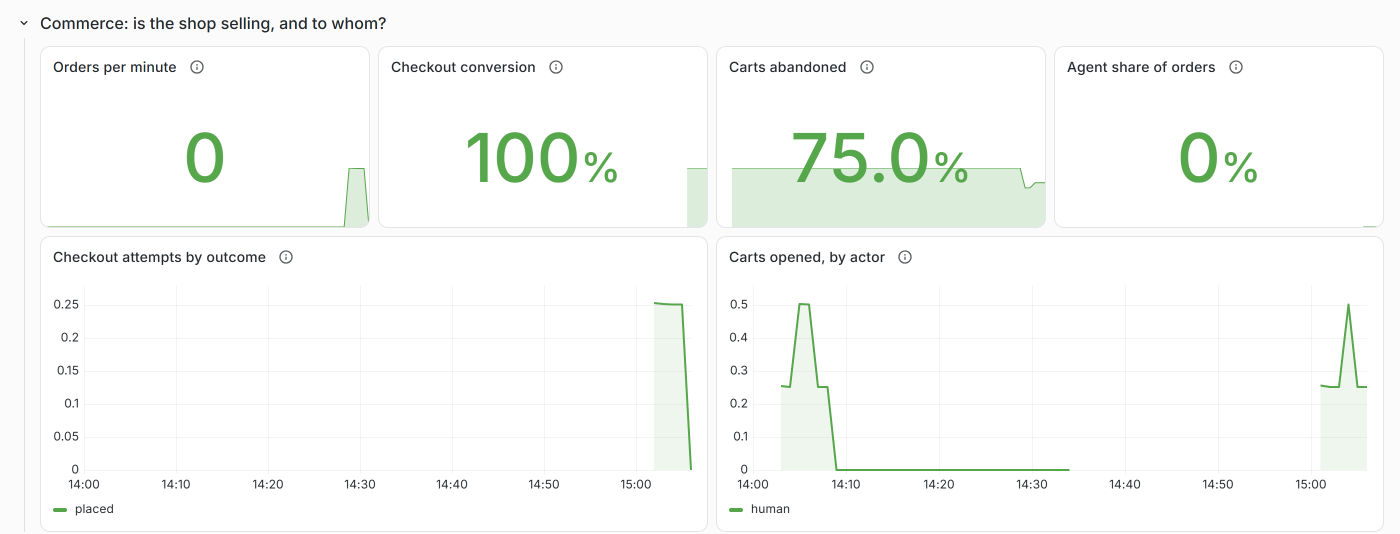
That is the Commerce row today, with the flag in place, over an hour of simulated traffic. Four carts were opened and one became an order, so the shop sees one attempt, one order and a conversion of 100 %, and three carts in four left behind. The order is there from its first point; before the flag, a first order like this one read as nothing. Every cart was opened by a person, because no agent bought anything in that hour. The Aspire dashboard could not have shown this. It draws each counter while the app runs, but it has no query language to turn two counters into a conversion rate, and it would have forgotten the orders at the next restart.
OpenTelemetry against Faro, decided before measuring
The port made one comparison possible: the same shop, the same traffic, a different SDK in the browser. I wrote down what I expected and committed it before the Faro adapter existed. The simulator that generated the traffic is the next article.
Same seed, 40 sessions each:
| OpenTelemetry | Faro | |
|---|---|---|
| Download, gzip | 36.4 KB | 67.9 KB |
| Telemetry sent per session | 3.1 KB in 2.6 requests | 30.1 KB in 8.4 requests |
| LCP / INP / CLS, p75 | 231 ms / 24 ms / 0.167 | 244 ms / 24 ms / 0.167 |
| Browser traces joined to the API | 97.8 % | 97.6 % |
LCP, INP and CLS are Google’s Core Web Vitals: how long the main content takes to appear, how fast the page answers a tap or a click, and how much the layout jumps while it loads. p75 is the value that three sessions in four stay under.
Faro gives more without being asked — a session, page views, its own events — and pays for it in size. I had predicted it would be at least twice as large. It was 1.87 times. Wrong, by a little, and the prediction stays in the file as it was written.
The real finding was not in the table. Faro sends what people type. Its own events describe every request the page makes, including the full URL, and the search URL contains the search. In one run, 170 lines in Loki held things like q=lampara que no ocupe sitio en la mesa. This is technical telemetry, so the consent the shop asks for does not stop it. The OpenTelemetry adapter had removed query strings and ids from URLs since the first day; Faro, as it comes, does not.
The Faro adapter now does the same, in one hook that runs before anything is sent (faro-adapter.ts, line 82). That hook took our adapter from 106 lines to 138 — one more than the OpenTelemetry one. OpenTelemetry stays the default. Faro stays one setting away, which is what a port is for.
What it does not do yet
- Product analytics — funnels stored for months, people against agents — waits for phase 11, where the agent checkout exists. This work sends the events; it does not keep them as analytics. (Phase 11 has been built since: the backoffice’s own dashboard shows people against agents, read from the shop’s database rather than from this stack, which is behind a switch.)
- Behavioural events in the browser wait for the shopper’s consent, which the storefront asks for once, with yes and no the same size.
- The Grafana mode is for a developer’s machine: one container, nothing sized for production. A deployed Tendero would run the same pieces as separate services, as On your machine, and everywhere else explains.
The repository is public and MIT licensed, and the code exactly as this article describes it is tagged blog/05-seeing-it-run. The plan and its generated document are in docs/telemetry/, and the comparison, expectations first, in docs/analysis/otel-vs-faro.md.
How we know it works
- The test that fails:
TrackingPlanTestswas broken on purpose five ways — an unplanned counter, a wrong unit, a live metric marked planned, an attribute namedproduct_id, an unplanned browser event — and each one turned it red, naming what it found. The last one also fails the TypeScript build. - The check on every pull request: the plan’s generated files are generated again and compared in CI, the Collector’s configuration and the Prometheus flag have their own tests, and both browser adapters pass one contract suite.
- The mutation score: not at this tag. Phase 9b closed the same day, just after it, with a Stryker run over every project it touched, about an hour of machine time; the traffic simulator’s first baseline came out at 87.66 % of covered. How to read that number is article 04.
Next article: A shop with no customers — a dashboard over no traffic is a flat line, so where did the forty sessions in that table come from?
Tendero — commerce for humans and agents.

